Over the last couple months, I’ve been learning about investing in Real Estate. Like most new to this field, I’m initially focusing on residential rentals. This entails learning what differentiates the good from the bad, how to diversify Real Estate investments, how to evaluate properties, and, most critically, how to analyze their returns. In this post, I’m going to explain the four pillars of Real Estate investment returns, detail some of my favorite measures of investment performance, and share my Rental Analysis Spreadsheet. Feel free to jump straight to the spreadsheet; I won’t stop you. 
Download my Rental Analysis Spreadsheet
(To get your own: Go to File > Make a Copy)
Real Estate presents four different mechanisms for investment returns:
- Cash Flow. Rental Real Estate (hopefully) produces rental income. Cash flow is what goes in your pocket after paying all expenses. This part of the return is considered an “inflation play” — the investor can benefit from inflation. Rent typically increases with inflation, but the mortgage payment stays fixed. SO over time you’re paying the mortgage with dollars that are worth less than today in terms of real purchasing power.
- Appreciation. When you buy a property, you hope that its price will increase faster than inflation. That’s appreciation. Similar to cash flow, appreciation is considered an “inflation hedge” — the investor is protected against inflation. Property values tend to keep pace with inflation.
- Loan Amortization. Your tenant is paying your mortgage for you; the principal portion of each payment is the amount of loan that was amortized. Although you don’t realize this gain until you sell the property, it’s there increasing your net worth month after month.
- Tax Benefits. Each year you get to depreciate your property and deduct mortgage interest. Both of these serve to shelter income from taxes, thereby reducing the amount you pay to Uncle Sam. In fact, in the early years after a purchase, you may have positive cash flow but show negative profit after these deductions, which could allow you to shelter a small amount of active income from taxation as well.
Each measurement highlights one or more of these returns and each has its own set of pros and cons. Some of the most popular measures include the Capitalization Rate, Cash-on-Cash Return, Return on Equity, and Internal Rate of Return.
Capitalization (Cap) Rate. The most basic measure is the Capitalization Rate. This is the de facto standard used for commercial real estate and is useful for quickly comparing returns in different markets, for example. It’s defined as Net Operating Income / Purchase Price.
Cash-on-Cash Return (COC). This measure expresses the annual return from cash flow in terms of the cash invested. Typically, the Cash-on-Cash Return for the first year is used, but you can calculate it for any given year. It’s defined as Cash Flow / Total Cash Invested. Sometimes the Purchase Price will be substituted for the Total Cash Invested. However, this ignores the costs of closing during purchase and isn’t a true representation for the return on their full investment.
Return on Equity (ROE) or Cash-on-Cash Return with Equity (COCE). Although this metric isn’t used as frequently, its nice because it accounts for the returns from the cash flow, appreciation, and loan amortization. In fact, if you calculate it using Cash Flow After Taxes (CFAT) instead of the standard Cash Flow Before Taxes (CFBT), then you can capture the tax benefits as well. It’s defined as Annual (Cash Flow + Principal Pay-Down + Appreciation) / (Total Cash Invested + Prior Equity Increases). However, like the preceding two measures, this represents a snapshot in time of the investment performance and thus does not account for the time value of money. (Said another way, a dollar today is worth more than a dollar tomorrow.)
Internal Rate of Return. Possibly the most popular metric for professional investors. The IRR attempts to correct the faults listed above by discounting future values to determine what they’re worth today. Rather than a point-in-time snapshot, it provides a measure of the investment performance over a holding period, or how long you plan to hold this property. As with the COC and COCE measures, it can represent all four returns including tax benefits if you use CFAT. It accounts for the purchase price, the cash flows through the years, and proceeds from selling the property at the end of the holding period. However, its susceptible to other problems; for example, it assumes that all cash flows can be reinvested at the same rate. More advanced measures such as the Modified Internal Rate of Return (MIRR) and Financial Management Rate of Return (FMRR) exist to overcome some of these shortcomings.
Now that we have an understanding of how to measure Real Estate investment returns, we can work through an example property evaluation using my Rental Analysis Spreadsheet.
Download my Rental Analysis Spreadsheet
(To get your own: Go to File > Make a Copy)
The numbers in this example are from a property in Memphis, Tennessee that I found exploring the listings of a turnkey real estate investment company which operates there. In fact, ahem, I may have modeled this spreadsheet on their web tool.
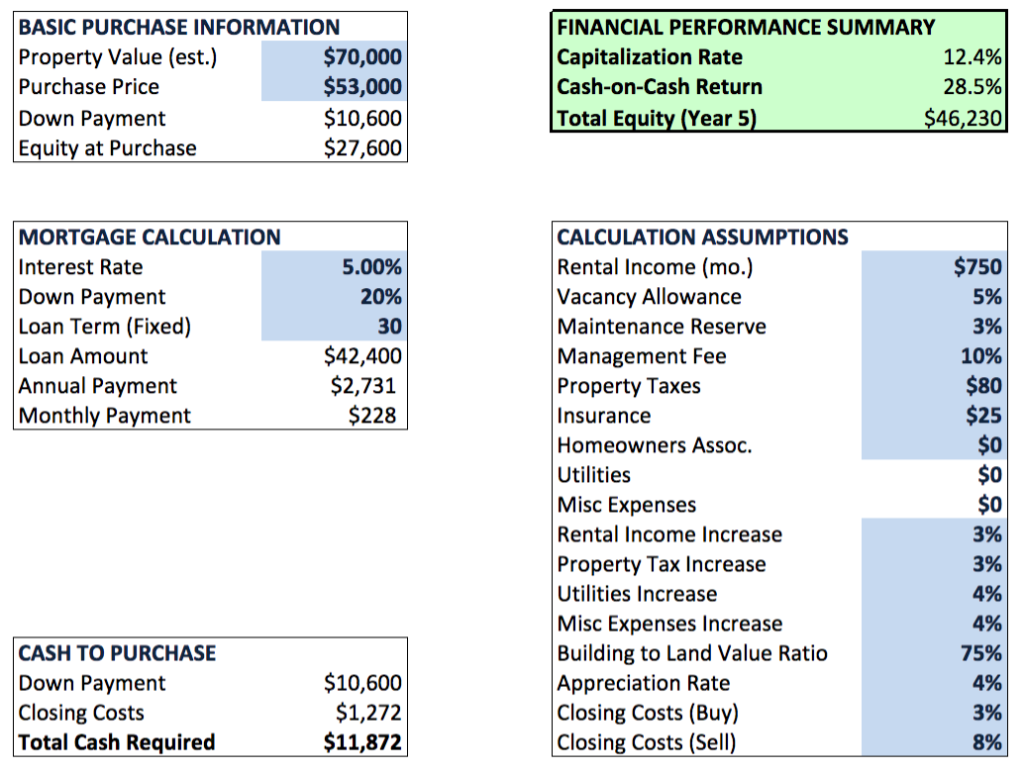
For this property, the purchase price is $53,000 and an appraisal recently came in at $70,000. This means that we have some built-in equity, which is great. (If you follow value investing with stocks, its the same idea; buy below intrinsic value for a margin of safety in your investment.) We’ll assume a fixed 30-year loan with 20% down and 5% interest. Most of the time investment properties require 25% down but, as in this case, some lenders will allow 20% with an increased interest rate. (You could run both scenarios in the spreadsheet to see which is more profitable.)
We have to estimate income, vacancy, and most expenses. Some data can be gleamed from records, such as previous rental leases, last year’s property taxes, recent utility bills, the latest property assessment, or by contacting an insurance company for a quote. Other information can be estimated for the particular market, such as typical vacancy rates, property management fees, appreciation rates, and portion of buyer- and seller- paid closing costs. And the maintenance reserve requires a more-informed estimate based on a property’s age and condition, recent renovations and the age of individual components.
You enter these data and assumptions into the Financial Summary sheet. (The blue boxes are editable. The others are not.) Since this is a single family home, we assume the tenant pays all utilities and misc expenses, so the individual line items (editable) for these categories are hidden.
Using this information, the green box gives you a quick summary of the investment performance. This Capitalization Rate uses the Net Operating Income excluding any vacancy allowances (since this assumption can vary its best for apples-to-apples comparisons). The estimated Cash-on-Cash Return is the best estimate of the first year’s return in terms of pure cash flow for the amount invested. Finally, the Total Equity shows you how much equity you’ll have from the initial investment, appreciation, and loan amortization after five years of ownership.
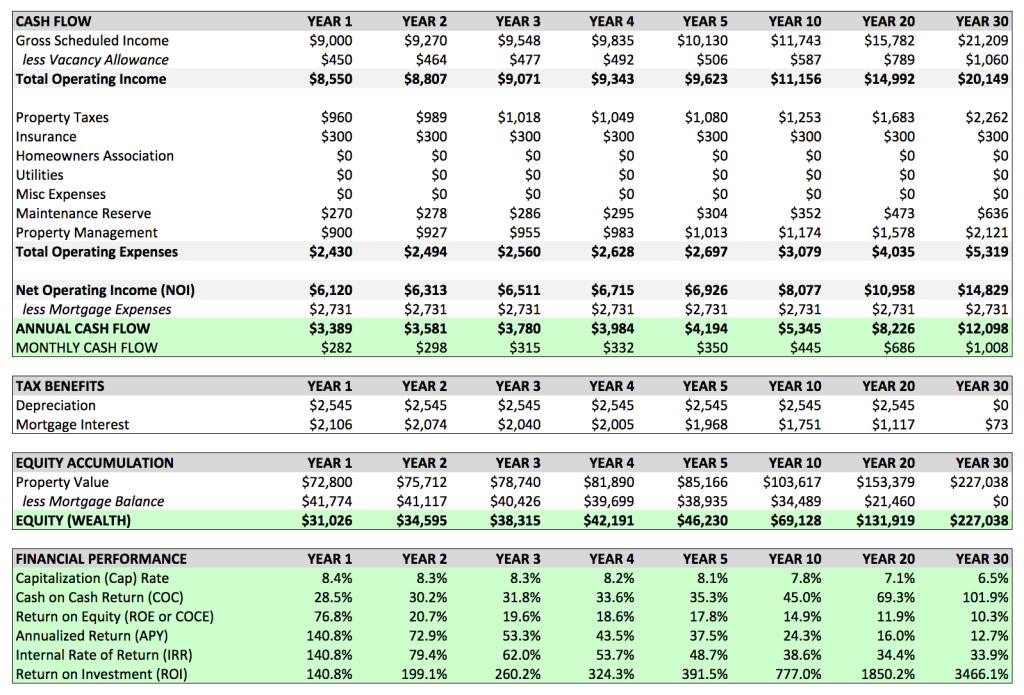
For a more detailed year-by-year look at the property’s performance behavior, turn to the Financial Analysis sheet. This sheet starts by building the Annual Property Operating Data to compute the Net Operating Income. The Net Operating Income shows your annual income after all expenses except debt service. This number is important because its purely a representation of the property’s performance; debt service can’t be included here because some investors may be able to receive better financing terms than others. Alternatively, you can think of the Net Operating Income as your cash flow if you purchased the property for cash.
The NOI is then used to calculate the expected Cash Flow using the given financing terms. The cash flow tells you how much money you put in your pocket (or take out) every month and for the entire year. This is the primary reason that most people like rental real estate; although you can sacrifice cash flow and hope for appreciation, that’s much riskier speculation.

The next section calculates the tax benefits due to mortgage interest deduction and depreciation for each year. However, this is merely given for your information rather than used in any subsequent calculations; all sections use the Cash Flow Before Taxes. Perhaps a version which computes these measures using Cash Flow After Tax numbers would be a good follow-up.
The equity accumulation section accounts for the equity in the property at the end of each year. As you recall, the equity will increase due to both appreciation and loan amortization. Although this wealth isn’t realized until you sell the property, its still a big piece of your net effective cash flow and is accounted for in several of the discussed measures.
Finally, it uses these absolute returns to compute the metrics discussed above as well as a few others. The point-in-time measures are given for the year. In this example, we can see that Year 5 provides a 35% Cash-on-Cash Return. Looking at the income and expenses reveals that income that’s increasing faster than expenses. In particular, the mortgage expenses is fixed so this spread will continue to grow over the years. The Internal Rate of Return is computed over the holding period. So the IRR for Year 5 shows the effective rate of return over the holding period on a pre-tax basis if you sold the property at the end of Year 5.
Download my Rental Analysis Spreadsheet
(To get your own: Go to File > Make a Copy)
Go forth and evaluate!


hi Cody, I am not sure if you will get a notification over this post, but I hope so. thx for your sheet and your explanations – very very helpful!
my question: you are calculating your property value by multiplying it with the rate of F38 of your Financial Summary tab. as this is the rate for utilities I would expect it was not recognised as the rate is the same (4%) but the property value should have been multiplying by the appreciation rate of F41, right?
I must’ve already caught and fixed this at some point. Thanks for sharing!
My brother is in real estate industry. I think that this article will definitely help him.I will share this to him.